
Datasheets tell you what a material is specified to do. Test curves tell you what it actually does - under load, and after three hundred cycles of real operation. Below is published test data from our lab for the 180 W/m·K graphene thermal pad, taken directly from the original measurement charts.
Test 1 - Compression vs clamping pressure
The first question every mount design asks: how much does the pad actually compress at the pressure my screws can deliver? The curve below shows measured deflection of the pad as clamping pressure rises from 10 to 50 psi.
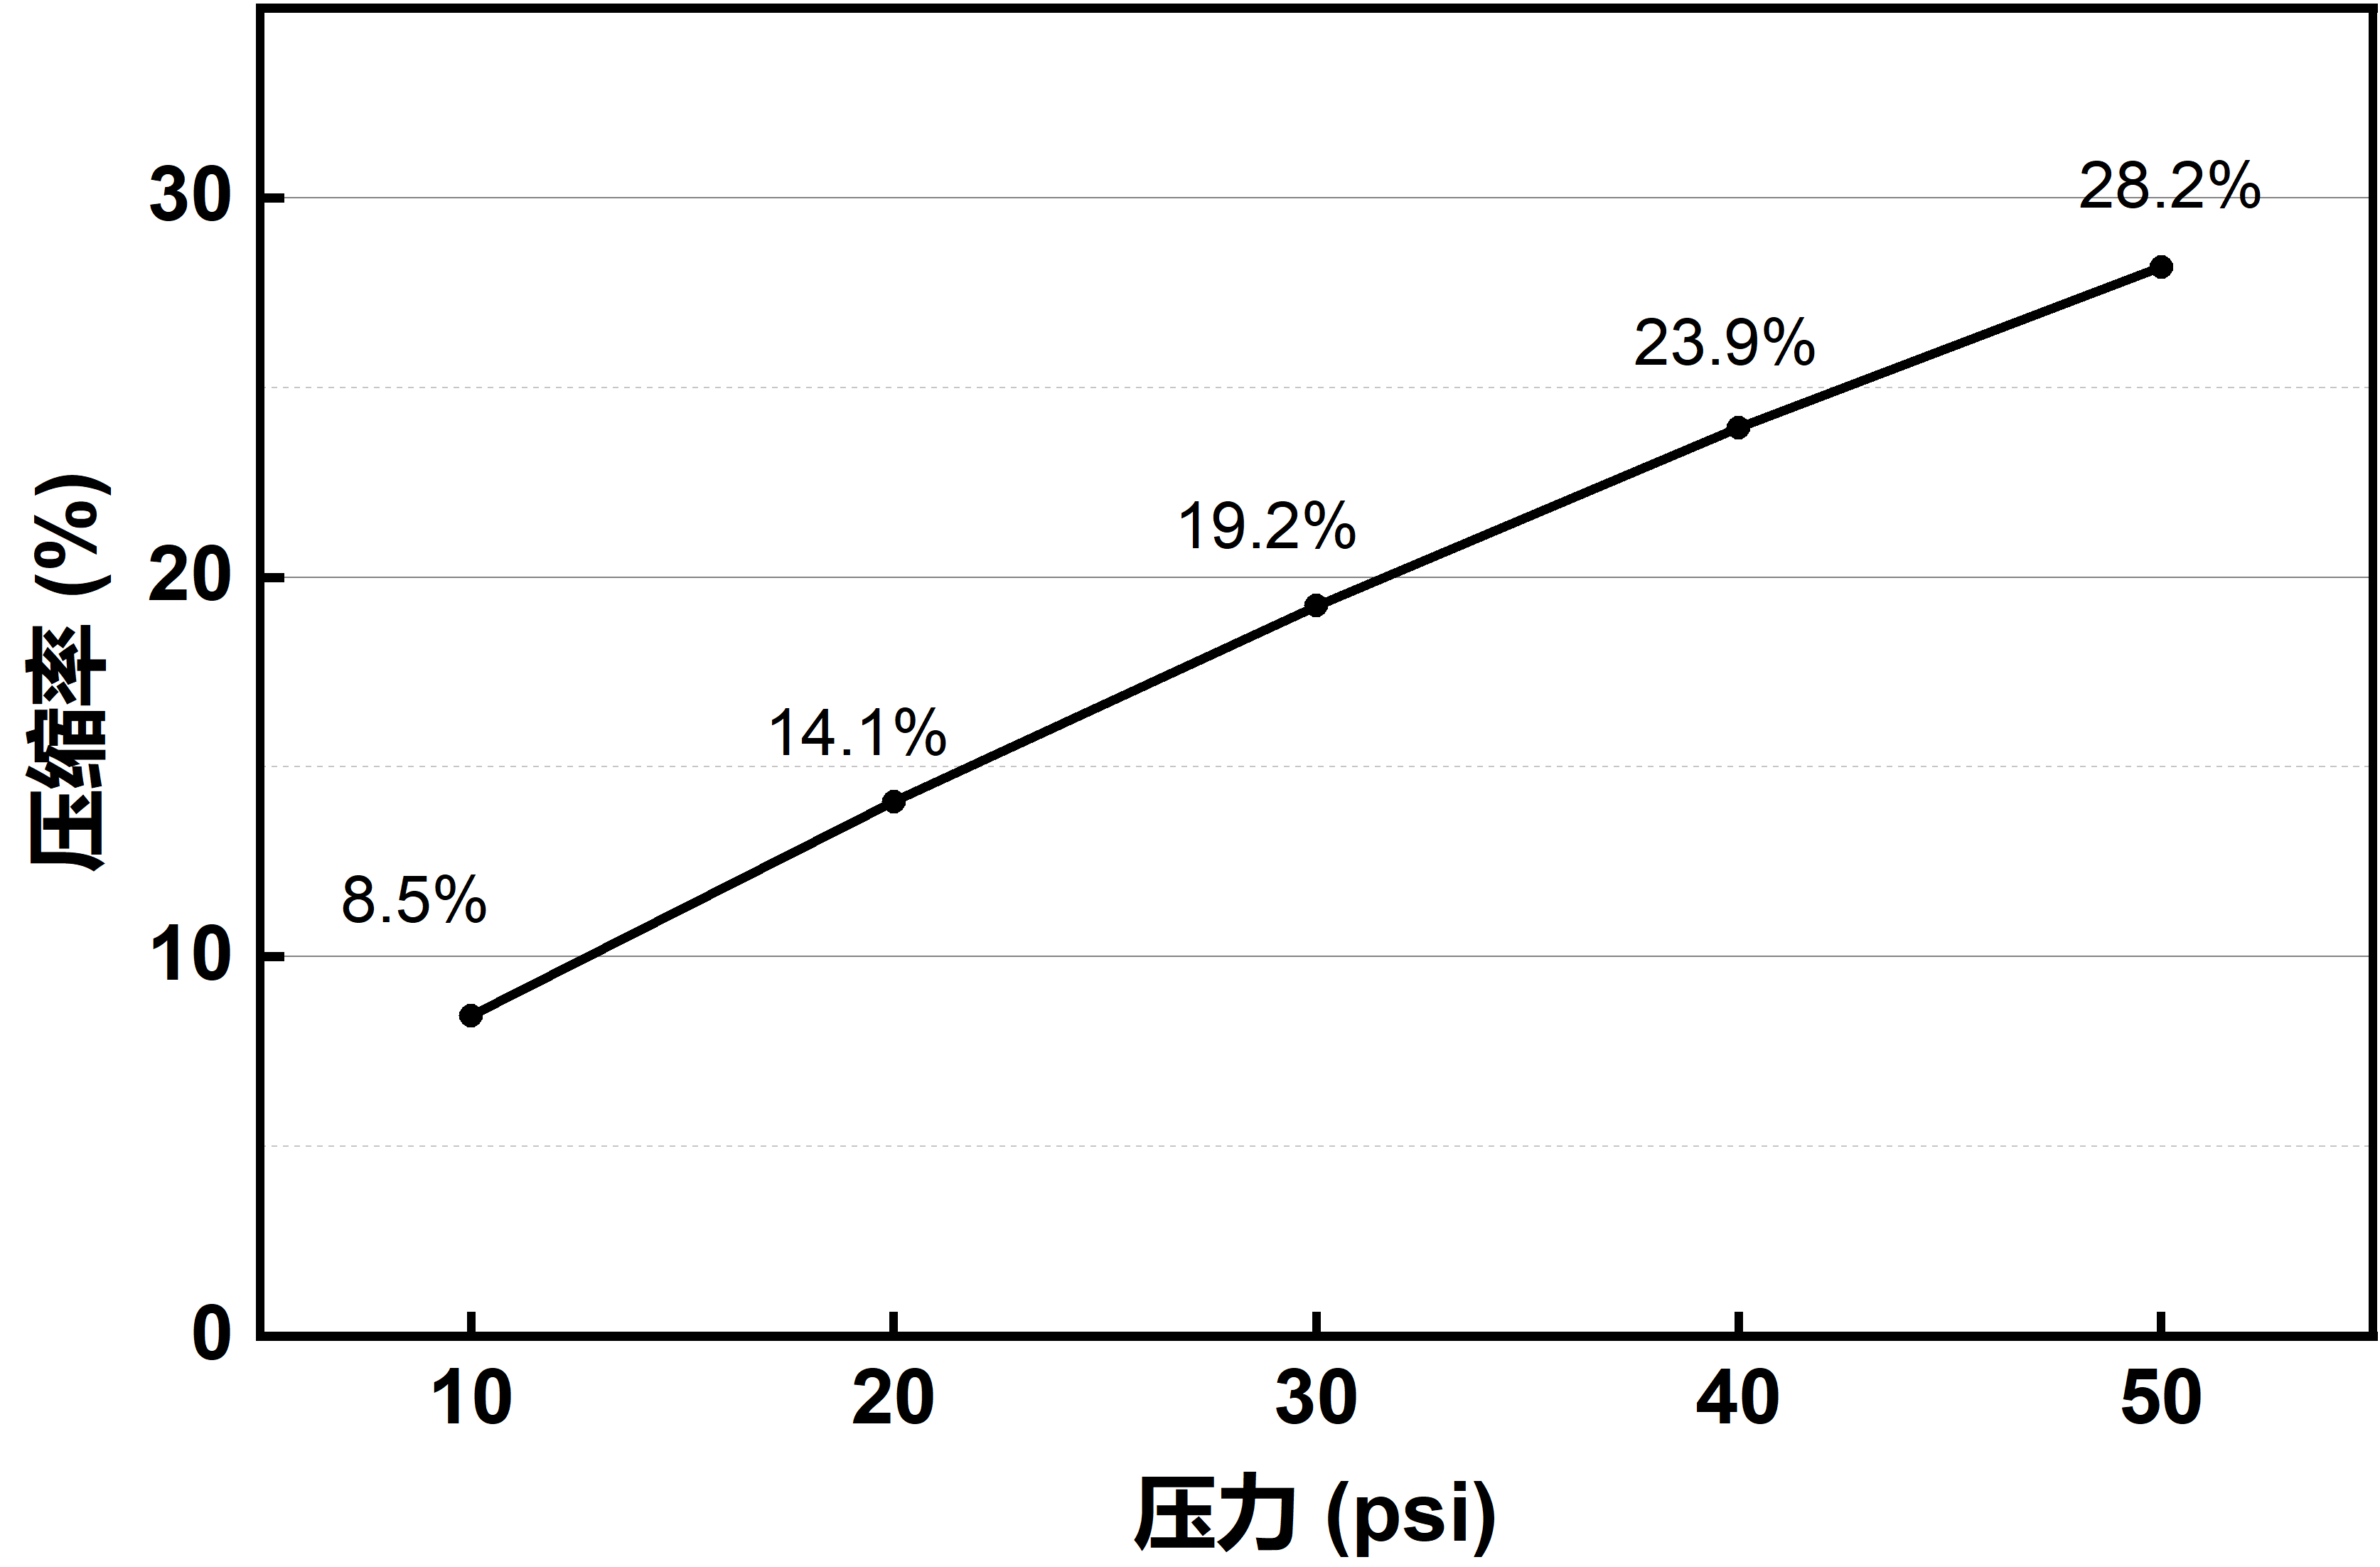
The same data, tabulated:
| Clamping pressure (psi) | Measured compression |
|---|---|
| 10 | 8.5% |
| 20 | 14.1% |
| 30 | 19.2% |
| 40 | 23.9% |
| 50 | 28.2% |
How to read it: the curve is steep in the 10-30 psi region and flattens progressively above that. In practice this means:
- Low-pressure mounts (spring clips, 10-20 psi). The pad still delivers 8.5-14% deflection, enough to conform to surface finish and take up tolerance stack - this is the regime where soft conformity matters more than datasheet-peak conductivity.
- Standard screw mounts (30-50 psi). Deflection reaches 19-28%, and the curve slope decreases - diminishing returns on adding pressure. Past roughly 40 psi, extra clamp buys little deflection; the resistance is then dominated by the bulk term, not contact.
- Gap design. Because compression is progressive rather than abrupt, the pad tolerates real-world tolerance stack: a gap that varies across the footprint compresses unevenly but stays in contact everywhere.
This curve is the practical companion to our hardness & compression guide - same physics, now with our own numbers attached.
Test 2 - Thermal resistance over 300 cycles
The second question - and the one that decides qualification: does the interface stay stable, or does it degrade in service? The chart below tracks thermal resistance of the pad through 300 test cycles.
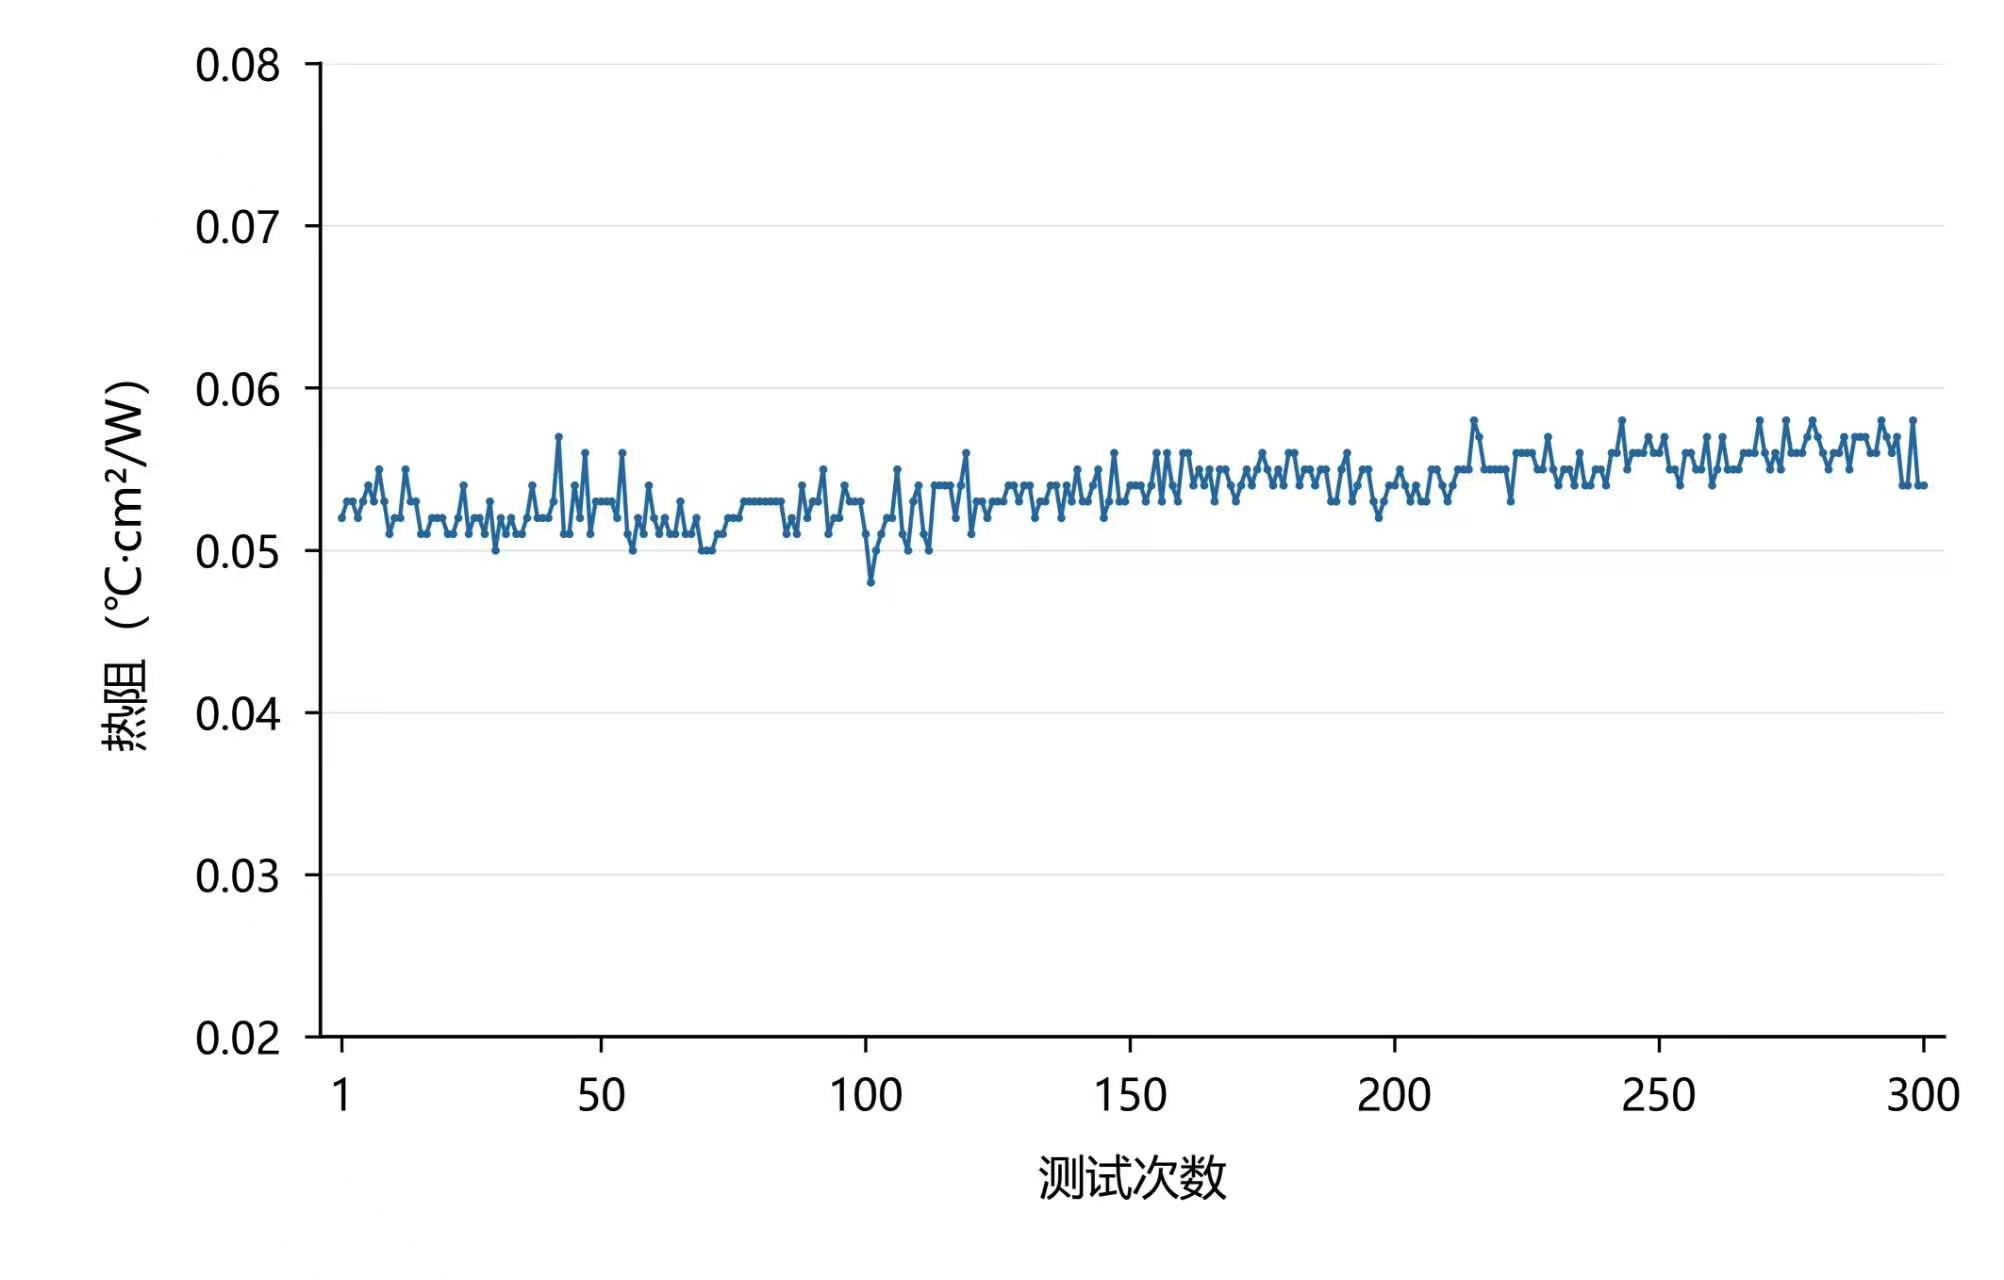
The reading stays within a narrow band of roughly 0.050-0.057 °C·cm²/W across all 300 cycles, with only a slight upward drift and no step change. Two things matter here:
- No pump-out signature. Greases typically show an initial low value that climbs as material migrates out of the joint under cycling. A cured solid pad shows the flat, slightly drifting trace you see here - the material stays where it was assembled.
- No silicone-bleed or dry-out step. Failure by oil separation or drying shows up as a sudden resistance jump. Across 300 cycles there is none.
For context on how to interpret these numbers against datasheets, see thermal impedance vs thermal resistance.
What this data is - and is not
We publish the original charts rather than redrawn marketing graphics, so the numbers are exactly as measured. Test conditions (sample thickness, exact pressure range, cycle profile) are documented in the full test report, which we share with qualified inquiries - ask for it when requesting a sample. Where your application pushes beyond this envelope - higher continuous temperature, higher power density, optical-grade cleanliness - tell us, and we will run the relevant test rather than extrapolate.