
Most TIM datasheets quote one resistance value at one pressure. That single number hides the most useful information: how the joint behaves at your clamping pressure, at your gap, across the whole operating range. So we measured it. Three thicknesses of the 180 W/m·K graphene thermal pad, ten clamping pressures each, thirty measured points - and the full curves are published below.
Test conditions
- Samples: 26 × 26 mm pads, nominal thickness 0.15 / 0.20 / 0.30 mm (measured initial thickness 0.159 / 0.197 / 0.292 mm - compression is calculated against the measured value, not the nominal one)
- Conditions: 80 °C, 600 s dwell per point
- Pressure: 5 to 50 psi, 10 points per thickness (30 measured points total)
- Fit quality: thermal resistance fitted as R(P) = a·P-b + c with R² ≥ 0.9993 for all three thicknesses; 95% confidence bands verified
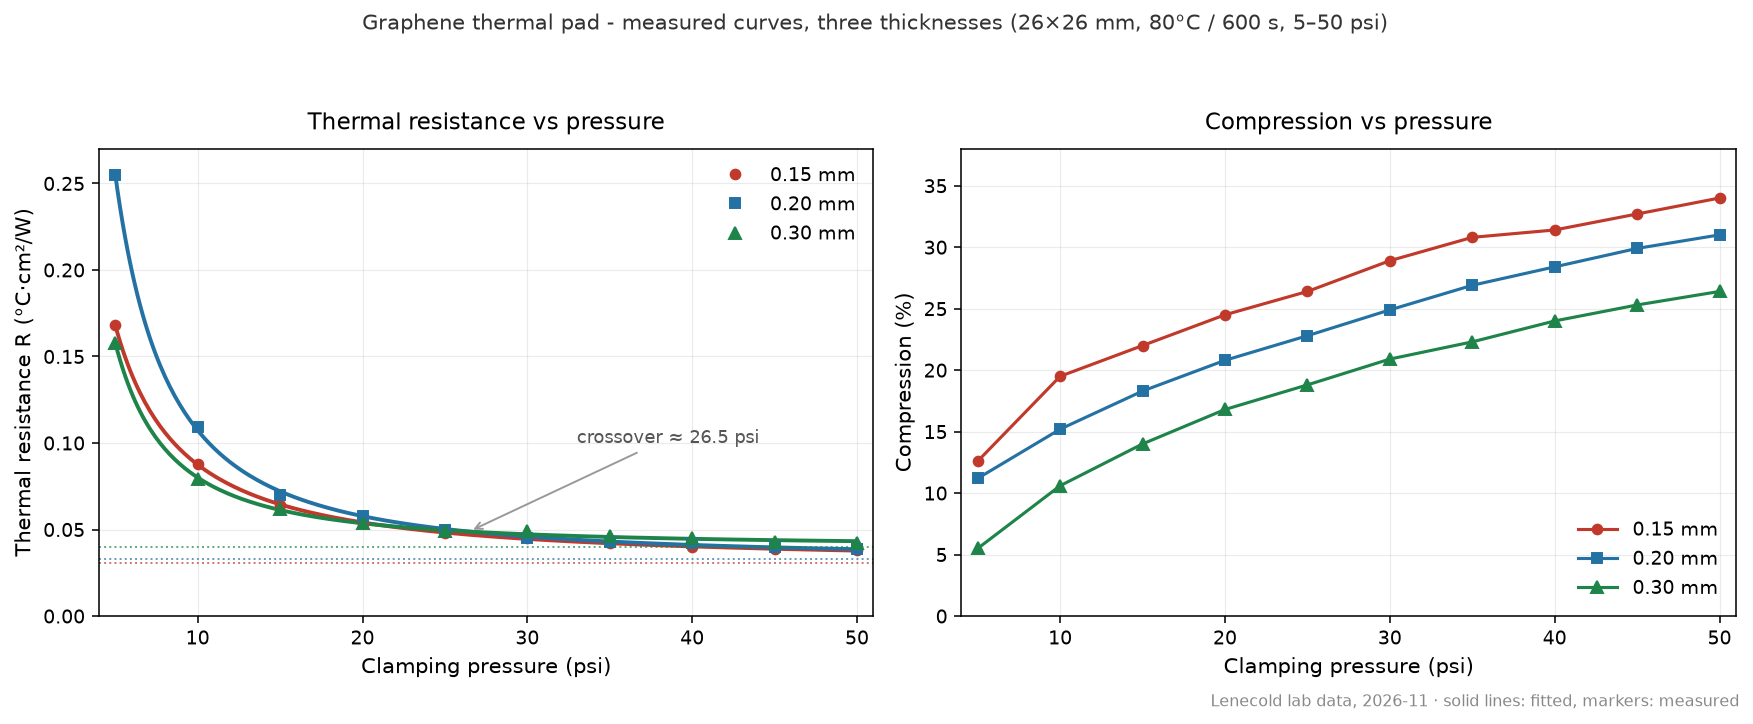
The full data table
Resistance in °C·cm²/W, compression in percent, all values as measured:
| Pressure (psi) | R 0.15 mm | R 0.20 mm | R 0.30 mm | C 0.15 mm | C 0.20 mm | C 0.30 mm |
|---|---|---|---|---|---|---|
| 5 | 0.168 | 0.255 | 0.158 | 12.6 | 11.2 | 5.5 |
| 10 | 0.088 | 0.109 | 0.079 | 19.5 | 15.2 | 10.6 |
| 15 | 0.064 | 0.070 | 0.062 | 22.0 | 18.3 | 14.0 |
| 20 | 0.054 | 0.058 | 0.054 | 24.5 | 20.8 | 16.8 |
| 25 | 0.048 | 0.050 | 0.049 | 26.4 | 22.8 | 18.8 |
| 30 | 0.045 | 0.045 | 0.049 | 28.9 | 24.9 | 20.9 |
| 35 | 0.042 | 0.043 | 0.046 | 30.8 | 26.9 | 22.3 |
| 40 | 0.040 | 0.042 | 0.045 | 31.4 | 28.4 | 24.0 |
| 45 | 0.039 | 0.040 | 0.043 | 32.7 | 29.9 | 25.3 |
| 50 | 0.038 | 0.039 | 0.042 | 34.0 | 31.0 | 26.4 |
Five things the curves tell you that a datasheet number does not
1. Thickness sets the floor - pressure decides everything above it
The residual term of each fit - the resistance you would still have at infinite pressure - rises monotonically with thickness: 0.030 / 0.033 / 0.040 °C·cm²/W for 0.15 / 0.20 / 0.30 mm. This is the most stable pattern in the whole dataset: the bulk of the pad cannot be squeezed away. But at the pressures real mounts deliver, all three curves converge: at 50 psi the three resistances sit within 0.038-0.042 °C·cm²/W. Pressure, not thickness, dominates in the working region.
2. At low pressure, thinner is not better - it can be worse
The counter-intuitive result: at 5 psi the 0.20 mm pad has the highest resistance of all three (0.255), while the 0.30 mm pad is the lowest (0.158). A thin, stiff pad needs pressure to conform; a thicker pad grabs the surface finish at low clamp. The 0.20 and 0.30 mm curves cross at about 26.5 psi. If your mount is a light spring clip, "just use the thinnest pad" is bad advice - check the low-pressure end of the curve first.
3. Ninety percent of the benefit is banked by 20 psi
For the 0.20 mm pad, going from 5 to 20 psi already delivers 91% of the total resistance reduction achieved by 50 psi (about 90% for the 0.30 mm pad). The steep part of the curve is where the money is. Beyond the knee, doubling clamp pressure buys single-digit percentages - if your screws are already delivering 25-30 psi, more torque is mostly a warranty risk, not a thermal gain.
4. Compression ranking is stable - and the thick pad saturates
Compression is ordered 0.15 > 0.20 > 0.30 across the whole range (34.0% / 31.0% / 26.4% at 50 psi). The 0.30 mm pad visibly saturates at high pressure - its compression curve flattens - while the thinner pads keep creeping. For tolerance-stack design: the thick pad takes up less of your gap variation at high clamp, which is either a benefit (stable joint) or a risk (open gap on a warped surface), depending on your flatness budget.
5. "Conductivity" measured at one pressure is not one number
The apparent through-plane conductivity derived from the 0.15 mm data rises from roughly 8 to 28 W/m·K between 5 and 50 psi. The material in the bottle does not change - what changes is contact fill. This is exactly why we ask for your clamping pressure before quoting an interface number, and why how the number was measured matters more than the number itself.
Quick selection guide from the curves
- Spring clip / low-pressure mount (<15 psi): favour thicker, softer pads; measured 0.30 mm data is the strongest performer here.
- Screw mount, controlled torque (25-40 psi): all three thicknesses converge within ~10%; choose by gap and tolerance, not by the datasheet headline.
- Design target ~20 psi: the knee of the curve. Below it, resistance rises steeply; above it, gains are marginal.
What this data is - and is not
Thirty measured points on production-type graphene pad material, published with the fitted equations and fit quality so you can reproduce our numbers. Full curve-fitting report (per-thickness independent fits, confidence bands, residual analysis) is available on request with samples. Production supply focuses on 0.3 mm and above, die-cut to your drawing; thinner gauges are lab builds evaluated case by case - tell us your gap and clamp and we will advise honestly whether it fits.
This study is the multi-thickness companion to our earlier single-thickness test data and 300-cycle stability article.